Semesterprojekt von Irene Sgarro
Water Levels in Venice – Visualisierung
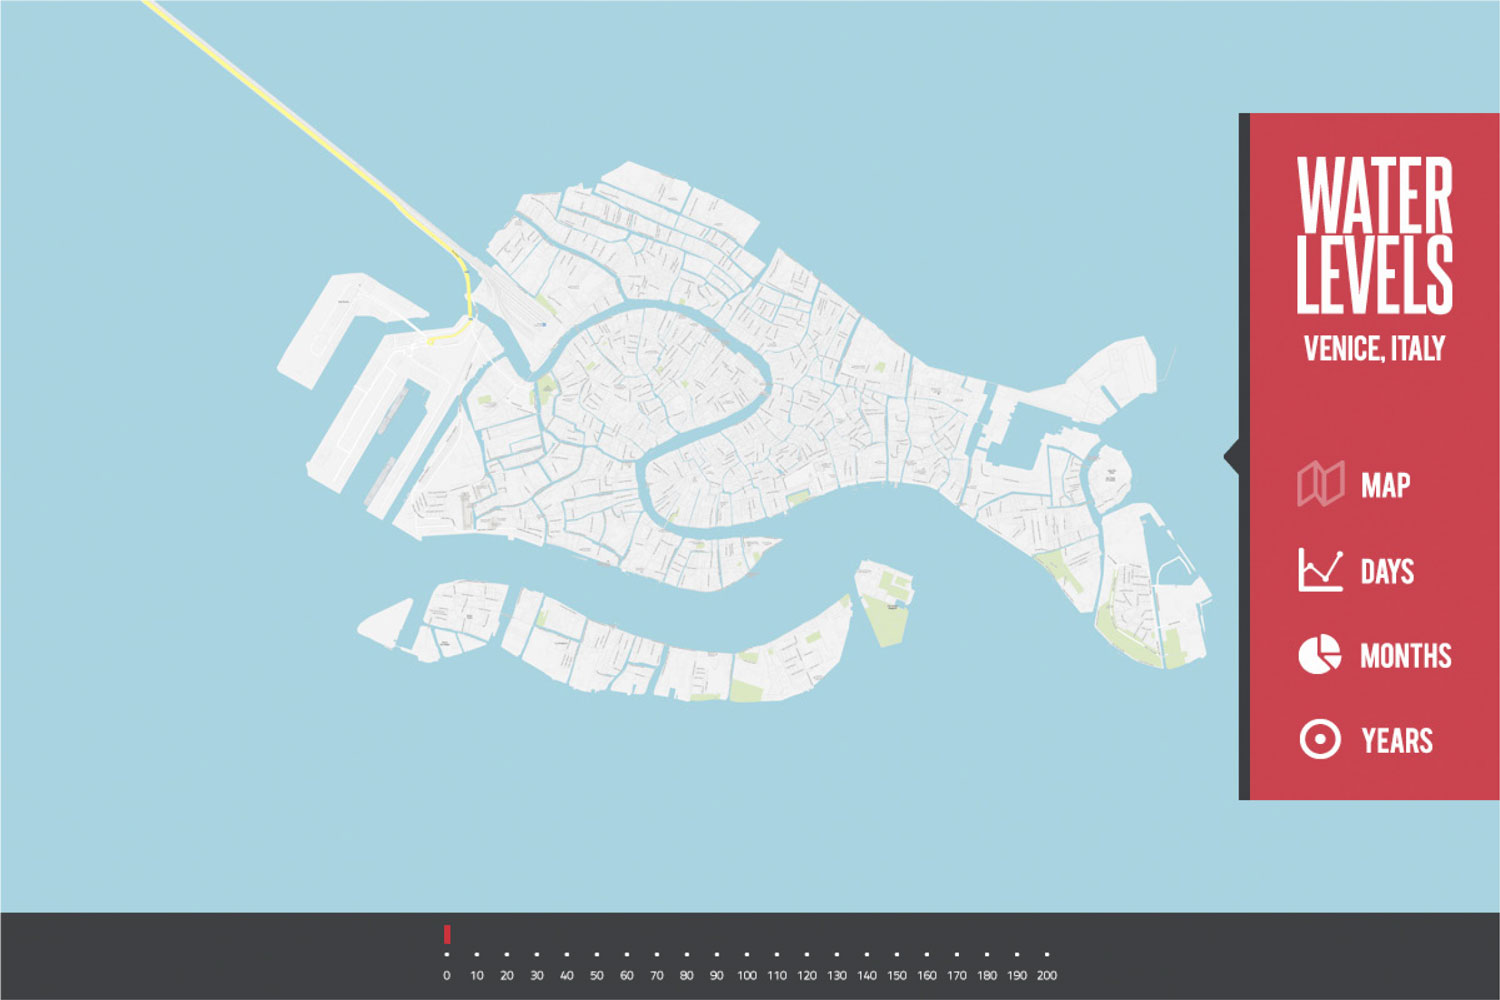
The project aims to represent the influence that the high water has on the city of Venice: this phenomenon causes big complications in the city and it is said to be increasing in the last years due to massive works in the canals of Venice. The current water level forecast visualization shows the tide variation through a line chart, which does not show how are the different city areas effectively hit by the high water. Moreover, it is not really clear what point in the city the water level refers to, or when will high water really occur and flood certain zones or streets.
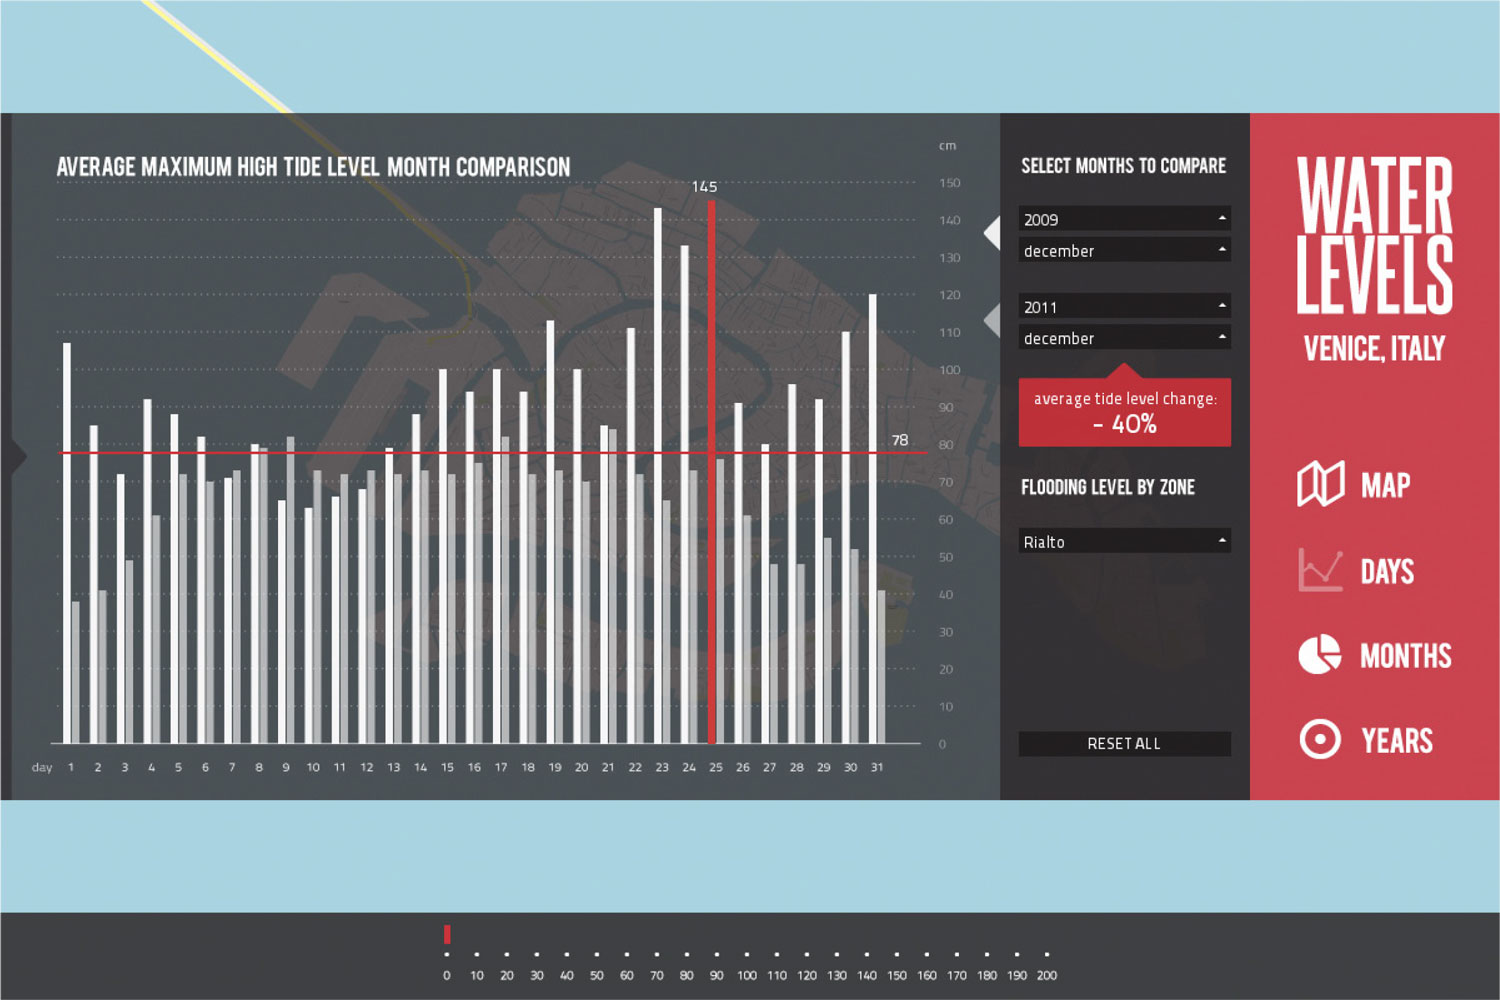
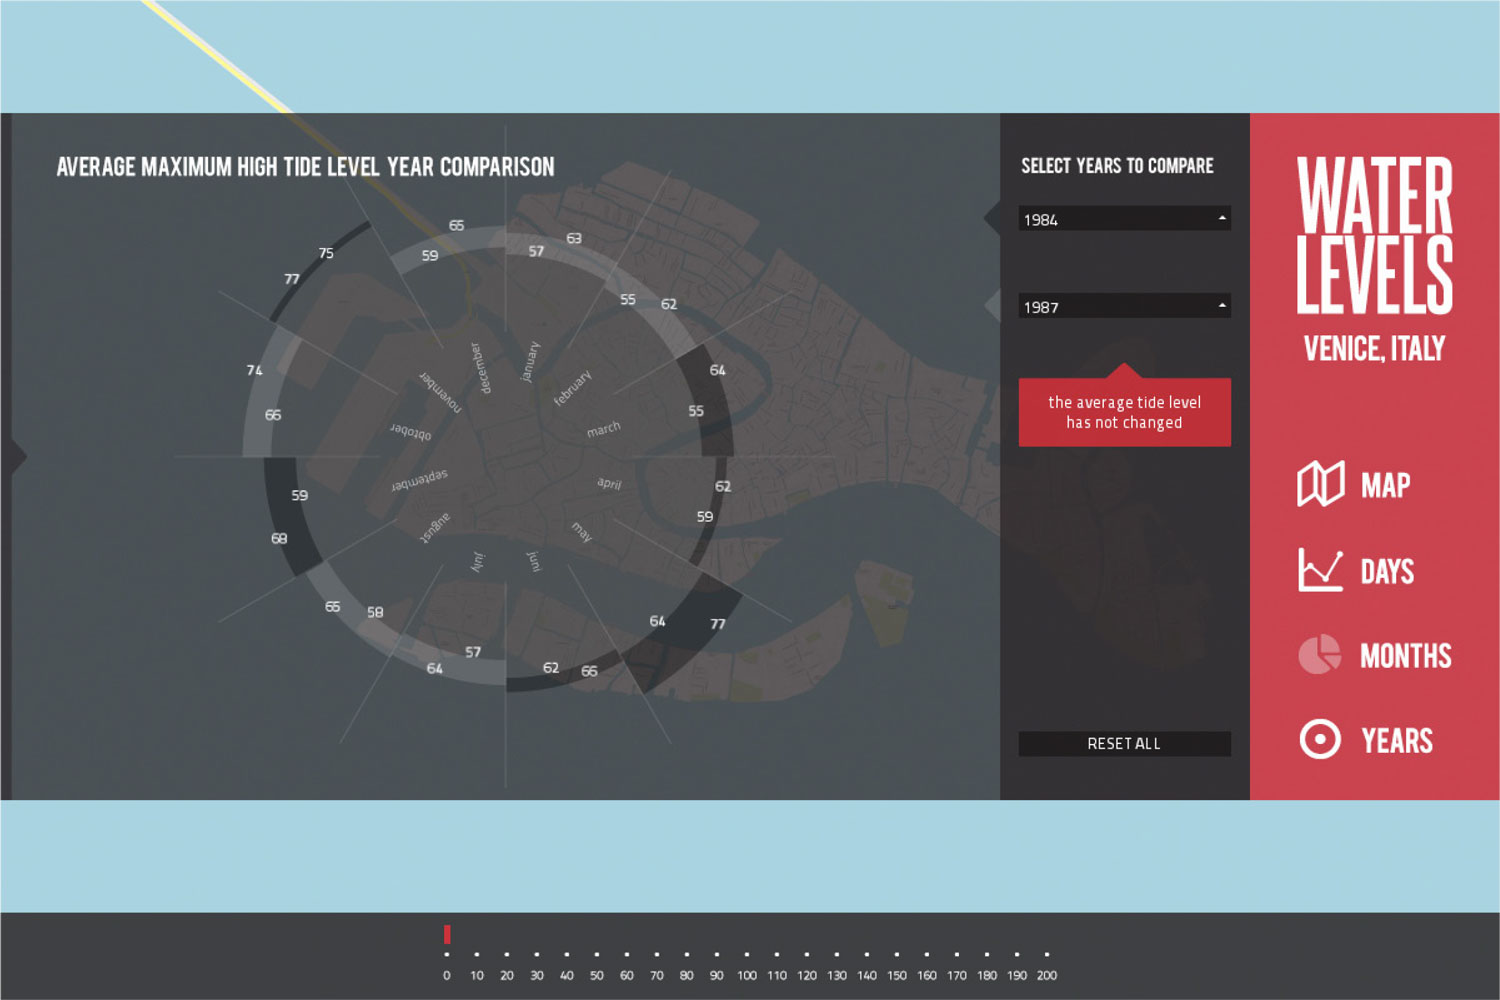
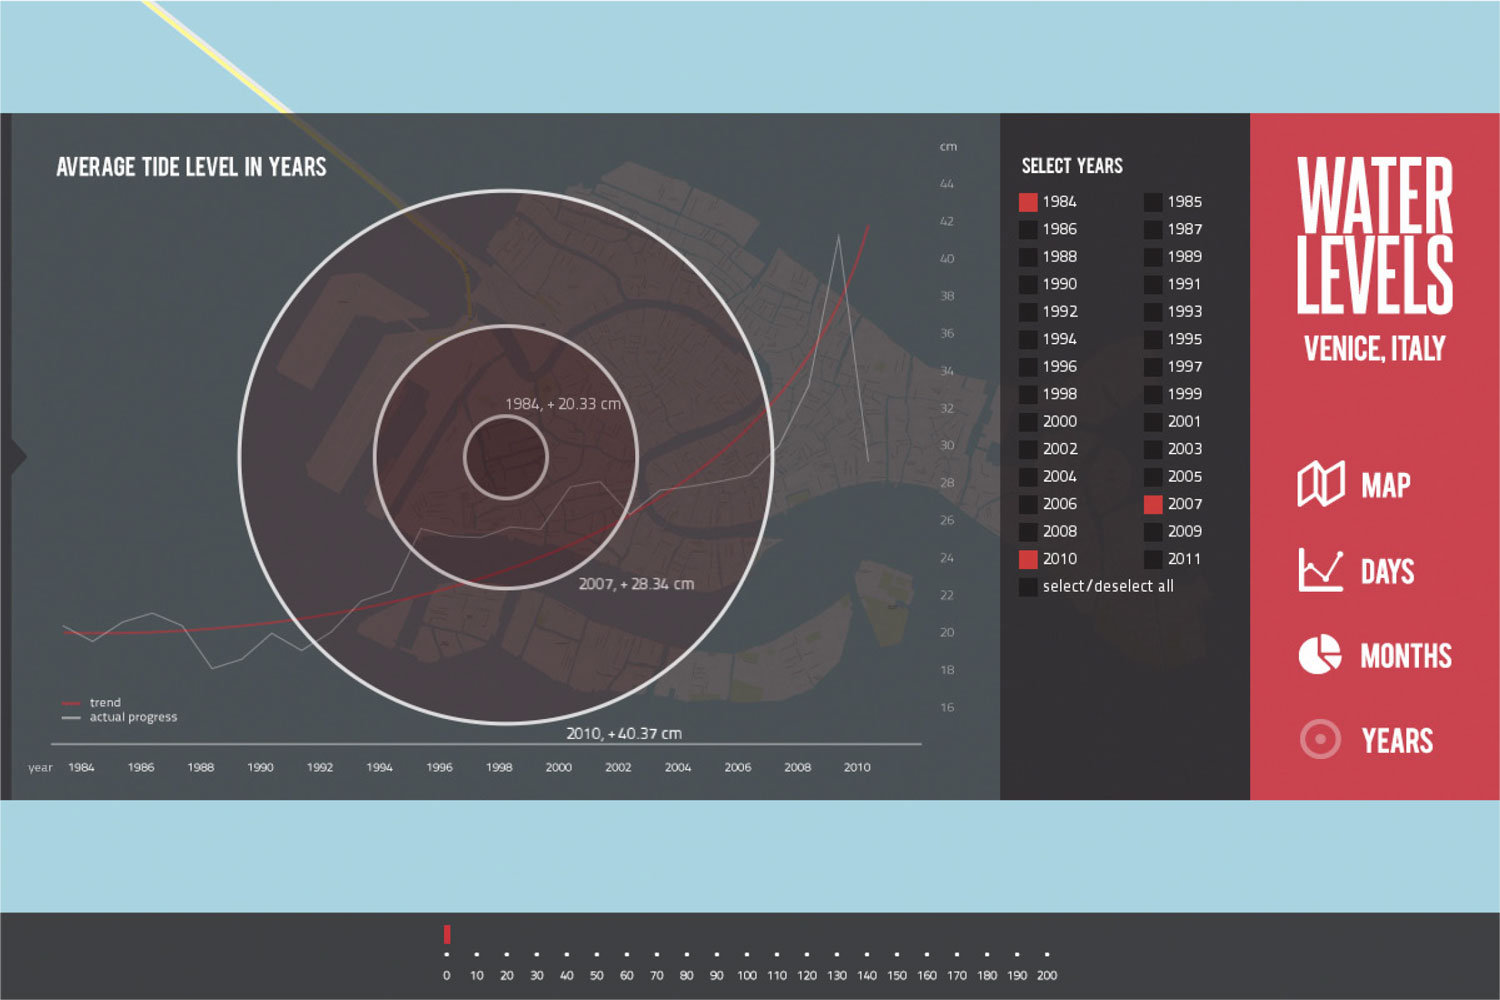
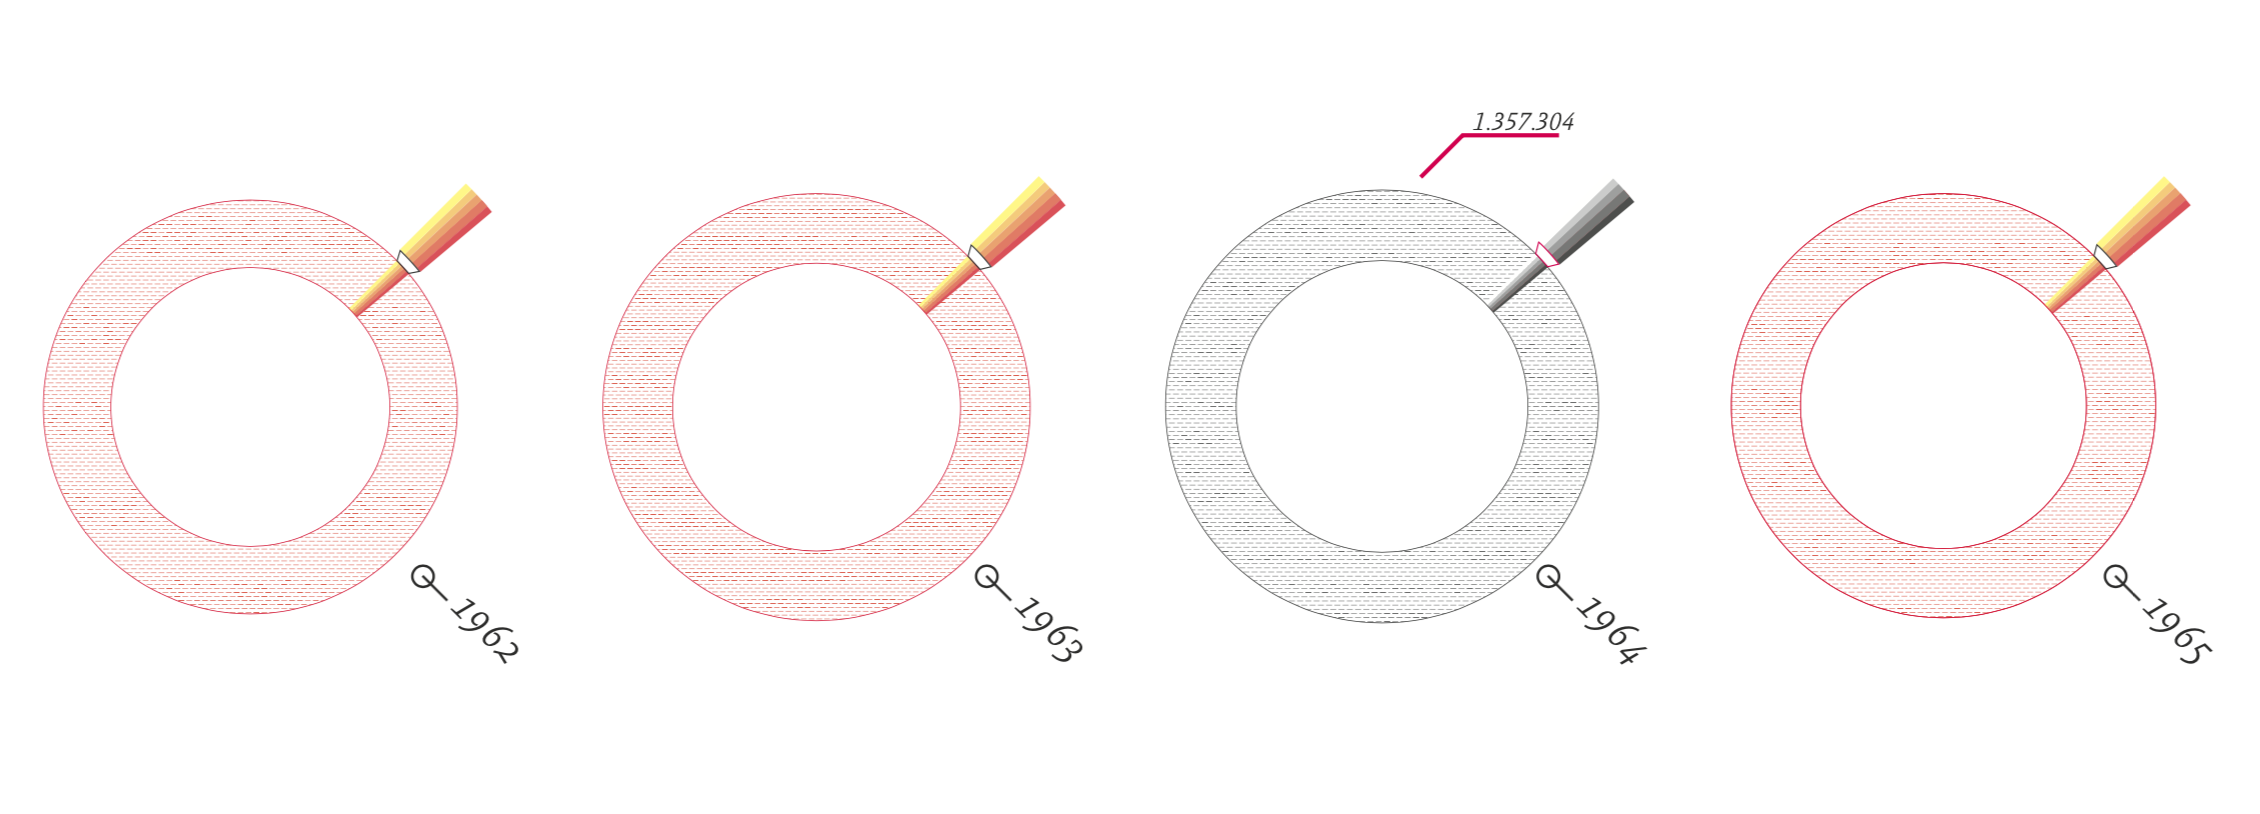
The actual forecasts graph should be implemented by combining it with a map of altitudes in order to make the water flooding directly visible. Furthermore, from 1984 the tide level has been recorded in a database for every hour of the day in the year: while numbers in a table can´t really show it clearly, a visualization could help to point out how and how much is effectively the average water level increasing in years.
The challenge was creating a stand-alone application which would replace the current forecasts graph. The application would be not only functional for the user interested in the provided information, but would also make people aware of the increasing of the tide level.
Solution: In the interactive application, the user can select the desired water level and see how are the areas of the map affected by high water. Moreover, a graphical visualization of historical data allows the comparison between tides in different days, months and years.
- Student Irene Sgarro
- Projektart Semesterprojekt
- Semester Wintersemester 2012/2013
- Seminar »Data Transformation«
- Betreut von Prof. Oliver Wrede
- Schwerpunkte Natur, Research, Wissen/Gesellschaft